2 years have passed since the Great East Japan Earthquake, but it will still take years to recover from the earth quake, tsunami and nuclear power plant accident in Japan back in 2011. It is important for us to remember and keep supporting the victims.
Cleaning of the debris from tsunami has finally passed 50%
Ministry of Environment in Japan announced that among the 3 prefectures (Iwate, Miyagi and Fukushima) that were hit by the tsunami, cleaning of the debris has finally passed 50%. (3,660,000 ton in Iwate, 11,030,000 ton in Miyagi and 1,610,000 ton in Fukushima, total 16,300,000 ton).
NHK: 震災がれき処理 ようやく半分終わる[ja]
This is Onagawa, back in April, 2012. We were literally driving in between the pile of debris on both sides of the road.
59% of the survey respondents replied reconstruction is not progressing
NHK (National TV station in Japan) created an infographic based on a survey with 1,000 citizens. They have English version as well.
Infographic "The Great East Japan Earthquake: Two Years Later"
Detailed survey result [ja]
Despite massive government funding, 59% replied reconstruction is not progressing, and many people are still unable to return to their hometowns.

Fear that the earthquake and/or they will be forgotten
I have heard from many people in the area that their biggest fear is to be forgotten. Most of the Japanese people are back to their lives before the earthquake, and beginning to forget about the crisis in Tohoku. Mainstream media's coverage on Tohoku has decreased. We need to remember, and keep supporting them.
According to a survey conducted by Kahoku Shinpo newspaper, 54.5% of the respondents replied they are afraid that the earthquake will be forgotten.
2013.03.13 石巻地方仮設住民にアンケート本社・河北新報社 震災の風化に不安[ja]
Memories for the Future
At the “Memories for the Future” website, you can see the photos, videos and Google Streetview images of Tohoku. Memories from before the quake is important since many of the photos were lost by tsunami. Memories from after the quake is painful but important so that we remember what happened and prepare for the future crisis. You can also see 360-degree panoramic imagery inside the buildings that were hit by the tsunami.
Memories for the Future website
Outside view
Inside buildings
大きな地図で見る
These are places that are able to visit and see with your own eyes. On the other hand, there are places you can't go.
Hangout among Fukushima's citizens in diaspora to connect
The citizens who were living near the Fukushima nuclear power plant are still prohibited to go back to their hometown due to radiation, and their citizens are in a diaspora to different places. Their community is torn down.
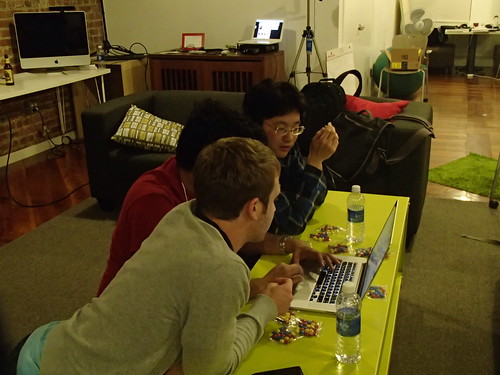
Can technology solve the problem? The answer is no, but it sure can help. The citizens of Futaba-cho are holding meetings called "Meeting for the recovery with 7,000 citizens (7000人の復興会議[ja])", and they used Google+ Hangouts to connect different cities that the citizens are in diaspora, via network.
Street view of Fukushima's exclusion zones
21,000 citizens of Namie City are also in diaspora to 30 different places, and unable to see their hometown. "After the earthquake, the world is moving towards the future. Japan is moving toward recovery. But our town Namie-cho has stopped even after 2 year have passed due to the radiation. Please see the current reality of the town. It is the responsibility of current generations to pass on our learnings, history and culture to the future generations." Says Mr. Baba, mayor of Namie.
In order to help keep the memory, document the current reality, and make it visible to those in the world who cannot actually visit Japan, Google Japan went to shoot Google Street View inside the area that is forbidden by the government to live.
Recovery Hangout on Air
When I visited Tohoku, I met someone who was getting a TV station crew documenting him for 2 days, but all of the things he wanted to broadcast was deleted by the TV crew, and the only thing that made it on the TV show was what the director asked him to say. This is not right. Internet is an excellent tool for people to get their voice heard. So we started a project called Fukko Hangout (Fukko means recovery), and tried to make it a tool for the victims to broadcast what they want others to know, with their own voice.
So the first Fukko Hangout we did was with local crisis radio stations. After the quake, power went down, and roads wer not drivable, so TV didn't work, newspapers were not delivered, radio was one of the best solutions to gather information for the victims.
People who were launching and running those radio stations faced lots of difficulties, and we thought such information should be shared so that we can prepare for the future disasters.
At the second Fukko Hangout, we focused on the city of Kesennuma. Because the city was hit by tsunami, shops in the shopping area were washed away, and temporary shopping area was rebuilt. However after interviewing several business owners there, they were facing various difficulties. TV stations would come and say this is great there are shops and the city is recovering, but those temporary shops are far from temporary houses that the victims are relocated, so only the tourist would come. Temporary houses are in the mountain side, temporary shops are in the ocean side. Also, current shops are "temporary" and there are limits to until when they can stay there and keep their operation. We had multiple business owners from multiple temporary shopping areas (there are 8 temporary shopping areas in Kesennuma) as guest speakers to discuss the issues.
After those several sessions, we realized that for some people, speaking in front of the camera and get them livestreamed is not as easy as we thought. Writing text, posting photos are much easier for them. So currently we are focusing on this Google+ channel to get live voices from the people to be heard.
Fukko Hangout Google+[ja]
Businesses decreasing in Tohoku, 72.5% decrease in Otsuchi
According to the census conducted by METI (Ministry of Economy, Trade and Industry) and MIC (Ministry of Internal Affairs and Communications) in 2012, many cities and towns in the coastal area of Tohoku went out of business, and in Otsuchi 72.5%, Minami Sanriku 69.0%, Onagawa 68.1% of the businesses decreased compared to the census in 2009.
Nikkei newspaper: 東北3県、津波被災地で事業所減る 大槌町は72.5%減[ja]
My blog post in Japanese on this matter: 経済センサス「東日本大震災の被災地で事業所減る」[ja]
Rebuilding the economy - Get Businesses Online
Local businesses in Tohoku were not very tech savvy, but since many of the stores were washed away by tsunami, they needed to rebuild their business, and technology companies started to help. Online became their new sales channel, and gradually expanding their reach.
Yahoo! Japan created an office in Ishinomaki, and started a website called "Yahoo Recovery Department Store [ja]" where you can purchase items from Tohoku.

Google Japan is also doing a project called "Get Business Online[ja]", teaching small business owners how to create websites and e-commerce sites.

One example that I like is the case of Kamaishi. First of all, local highschool students learned how to create websites. Then next, those students taught local business owners how to create websites. I think this is can be a sustainable model.
Iwate Nippo newspaper: "Highschool students teaches how to create websites in Kamaishi 高校生が指南、ウェブサイト作成 釜石で講習会[ja]
Rebuilding the economy for 10 years future- Learning how to code
When I visited Tohoku, several people asked me to start a "Google Dojo" to teach technology. I sat on it for a while.
In Tohoku, main industry was agriculture and fishery. However soil is damaged by sea water from tsunami, and agriculture industry is greatly damaged. Fishery was difficult since many of the ships were wrecked, and radiation in the sea water was a problem. Also, factories were washed away by tsunami, so those industries were damaged as well. They apparently needed a new industry to recover the economy, and IT seemed to be a good option. Although- we can't make non-tech savvy old people to learn how to code, so we decided to work with the younger generation, and start a tech dojo.

I didn't want to make it a school, because if it is a school, people who comes will just sit there and listen. They expect "teachers to teach them". What we wanted to realize was to make an infrastructure where only those who really wants to learn to code will come voluntarily, teach each other, not just sit during dojo but code during dojo, code after going home, and come back to the next dojo aggressively with lots of questions.
We hosted 2 dojo per month in a physical space, sending tutors from Tokyo to Tohoku physically. Also, we hosted 2 online dojo using Hangout on Air twice a week, so that those who were stuck with questions can ask experts online, share screens and look into the issues, solve them and move forward.
We started our first dojo in November 2012- December 2012 with Sendai, Ishinomaki and Takizawa venues, the second dojo was in February 2013- March 2013 with Ishinomaki and Takizawa venues, and the third dojo will be held on April 2013- June 2013 with Sendai, Ishinomaki, Takizawa, Kitakami and Kanazawa.
Many of the dojo participants are highschool students, but we have housewives, designers, and even junior highschool students.
Preparing for the next disaster - preparing data sets
During the earthquake in 2011, many local governments, tech companies and citizens were scrambling to gather data, provide data, find data, and it was a chaos. Learning from that experience, many Japanese local governments and data holders (infrastructure companies) are starting to partner with tech companies so that when the next disaster happens, they will be prepared to provide data to the citizens involved.
For example, Google partnered with 7 local governments in Japan so that they can provide various data in case of natural disasters- safety information, evacuation center and evacuation routes, hazard maps, etc, and Google will map those data on Google maps and provide to the citizens.

Also, NTT Docomo, KDDI, Softbank Mobile (mobile carriers in Japan) are providing their mobile signal recovery data- whether you have mobile signal or not is extremely important in securing communication during crisis. Tokyo Gas is providing gas lifeline data. Gas is important to secure heat and cooking. Honda will be providing car traffic information data based on their GPS on automobiles- during the 2011 crisis, coastal areas were hit by tsunami and it was hard to know which roads are drivable. Honda's data helped to figure out where they should go with their cars. FirstMedia and WeatherNews will be providing their evacuation center data and citizen reports on disasters.

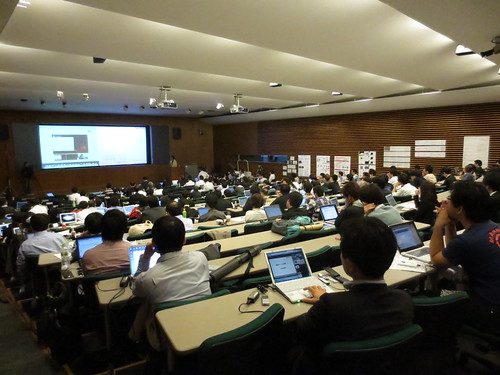
After 1.5 years have passed since the earthquake, we launched a project called "Project311- The Great East Japan Earthquake Big Data Workshop" to gather researchers and developers to revisit and analyze various data from the quake, to get a clue of what can be done to prepare for future disasters.
Data provided includes Asahi Shimbun newspaper articles, Google Insights for Search, text summary of television broadcasts made just after the Great East Japan Earthquake, tweets from the week after March 11, transcripts of the audio broadcasted by NHK in the 24 hours following the disaster and a ranking of frequently used words, Honda Internavi traveled roads data, Rescuenow's railroad operation information and various disaster-related information, traffic congestion statistics from cell phone data, etc.
If you are interested in this project, I started writing blog post about them separately so please check it out.
Project311- About the Data
The bottom line is, there still a long way to go till recovery, but we're doing a lot, making a lot of efforts to help for the recovery of Japan, and it's important that we keep doing it.
Disclaimer: The opinions expressed here are my own, and do not reflect those of my employer. -Fumi Yamazaki
Cleaning of the debris from tsunami has finally passed 50%
Ministry of Environment in Japan announced that among the 3 prefectures (Iwate, Miyagi and Fukushima) that were hit by the tsunami, cleaning of the debris has finally passed 50%. (3,660,000 ton in Iwate, 11,030,000 ton in Miyagi and 1,610,000 ton in Fukushima, total 16,300,000 ton).
NHK: 震災がれき処理 ようやく半分終わる[ja]
This is Onagawa, back in April, 2012. We were literally driving in between the pile of debris on both sides of the road.
59% of the survey respondents replied reconstruction is not progressing
NHK (National TV station in Japan) created an infographic based on a survey with 1,000 citizens. They have English version as well.
Infographic "The Great East Japan Earthquake: Two Years Later"
Detailed survey result [ja]
Despite massive government funding, 59% replied reconstruction is not progressing, and many people are still unable to return to their hometowns.

Fear that the earthquake and/or they will be forgotten
I have heard from many people in the area that their biggest fear is to be forgotten. Most of the Japanese people are back to their lives before the earthquake, and beginning to forget about the crisis in Tohoku. Mainstream media's coverage on Tohoku has decreased. We need to remember, and keep supporting them.
According to a survey conducted by Kahoku Shinpo newspaper, 54.5% of the respondents replied they are afraid that the earthquake will be forgotten.
2013.03.13 石巻地方仮設住民にアンケート本社・河北新報社 震災の風化に不安[ja]
Memories for the Future
At the “Memories for the Future” website, you can see the photos, videos and Google Streetview images of Tohoku. Memories from before the quake is important since many of the photos were lost by tsunami. Memories from after the quake is painful but important so that we remember what happened and prepare for the future crisis. You can also see 360-degree panoramic imagery inside the buildings that were hit by the tsunami.
Memories for the Future website
Outside view
Inside buildings
大きな地図で見る
These are places that are able to visit and see with your own eyes. On the other hand, there are places you can't go.
Hangout among Fukushima's citizens in diaspora to connect
The citizens who were living near the Fukushima nuclear power plant are still prohibited to go back to their hometown due to radiation, and their citizens are in a diaspora to different places. Their community is torn down.
Can technology solve the problem? The answer is no, but it sure can help. The citizens of Futaba-cho are holding meetings called "Meeting for the recovery with 7,000 citizens (7000人の復興会議[ja])", and they used Google+ Hangouts to connect different cities that the citizens are in diaspora, via network.
7000人会議ネットでつながり、議論に熱が上がります(^-^)v twitter.com/Fkafe_juju/sta…
— F カフェ 珠寿 (@Fkafe_juju) December 10, 2012
Street view of Fukushima's exclusion zones
21,000 citizens of Namie City are also in diaspora to 30 different places, and unable to see their hometown. "After the earthquake, the world is moving towards the future. Japan is moving toward recovery. But our town Namie-cho has stopped even after 2 year have passed due to the radiation. Please see the current reality of the town. It is the responsibility of current generations to pass on our learnings, history and culture to the future generations." Says Mr. Baba, mayor of Namie.
In order to help keep the memory, document the current reality, and make it visible to those in the world who cannot actually visit Japan, Google Japan went to shoot Google Street View inside the area that is forbidden by the government to live.
Recovery Hangout on Air
When I visited Tohoku, I met someone who was getting a TV station crew documenting him for 2 days, but all of the things he wanted to broadcast was deleted by the TV crew, and the only thing that made it on the TV show was what the director asked him to say. This is not right. Internet is an excellent tool for people to get their voice heard. So we started a project called Fukko Hangout (Fukko means recovery), and tried to make it a tool for the victims to broadcast what they want others to know, with their own voice.
So the first Fukko Hangout we did was with local crisis radio stations. After the quake, power went down, and roads wer not drivable, so TV didn't work, newspapers were not delivered, radio was one of the best solutions to gather information for the victims.
People who were launching and running those radio stations faced lots of difficulties, and we thought such information should be shared so that we can prepare for the future disasters.
At the second Fukko Hangout, we focused on the city of Kesennuma. Because the city was hit by tsunami, shops in the shopping area were washed away, and temporary shopping area was rebuilt. However after interviewing several business owners there, they were facing various difficulties. TV stations would come and say this is great there are shops and the city is recovering, but those temporary shops are far from temporary houses that the victims are relocated, so only the tourist would come. Temporary houses are in the mountain side, temporary shops are in the ocean side. Also, current shops are "temporary" and there are limits to until when they can stay there and keep their operation. We had multiple business owners from multiple temporary shopping areas (there are 8 temporary shopping areas in Kesennuma) as guest speakers to discuss the issues.
After those several sessions, we realized that for some people, speaking in front of the camera and get them livestreamed is not as easy as we thought. Writing text, posting photos are much easier for them. So currently we are focusing on this Google+ channel to get live voices from the people to be heard.
Fukko Hangout Google+[ja]
Businesses decreasing in Tohoku, 72.5% decrease in Otsuchi
According to the census conducted by METI (Ministry of Economy, Trade and Industry) and MIC (Ministry of Internal Affairs and Communications) in 2012, many cities and towns in the coastal area of Tohoku went out of business, and in Otsuchi 72.5%, Minami Sanriku 69.0%, Onagawa 68.1% of the businesses decreased compared to the census in 2009.
Nikkei newspaper: 東北3県、津波被災地で事業所減る 大槌町は72.5%減[ja]
My blog post in Japanese on this matter: 経済センサス「東日本大震災の被災地で事業所減る」[ja]
Rebuilding the economy - Get Businesses Online
Local businesses in Tohoku were not very tech savvy, but since many of the stores were washed away by tsunami, they needed to rebuild their business, and technology companies started to help. Online became their new sales channel, and gradually expanding their reach.
Yahoo! Japan created an office in Ishinomaki, and started a website called "Yahoo Recovery Department Store [ja]" where you can purchase items from Tohoku.

Google Japan is also doing a project called "Get Business Online[ja]", teaching small business owners how to create websites and e-commerce sites.

One example that I like is the case of Kamaishi. First of all, local highschool students learned how to create websites. Then next, those students taught local business owners how to create websites. I think this is can be a sustainable model.
Iwate Nippo newspaper: "Highschool students teaches how to create websites in Kamaishi 高校生が指南、ウェブサイト作成 釜石で講習会[ja]
Rebuilding the economy for 10 years future- Learning how to code
When I visited Tohoku, several people asked me to start a "Google Dojo" to teach technology. I sat on it for a while.
In Tohoku, main industry was agriculture and fishery. However soil is damaged by sea water from tsunami, and agriculture industry is greatly damaged. Fishery was difficult since many of the ships were wrecked, and radiation in the sea water was a problem. Also, factories were washed away by tsunami, so those industries were damaged as well. They apparently needed a new industry to recover the economy, and IT seemed to be a good option. Although- we can't make non-tech savvy old people to learn how to code, so we decided to work with the younger generation, and start a tech dojo.

I didn't want to make it a school, because if it is a school, people who comes will just sit there and listen. They expect "teachers to teach them". What we wanted to realize was to make an infrastructure where only those who really wants to learn to code will come voluntarily, teach each other, not just sit during dojo but code during dojo, code after going home, and come back to the next dojo aggressively with lots of questions.
We hosted 2 dojo per month in a physical space, sending tutors from Tokyo to Tohoku physically. Also, we hosted 2 online dojo using Hangout on Air twice a week, so that those who were stuck with questions can ask experts online, share screens and look into the issues, solve them and move forward.
We started our first dojo in November 2012- December 2012 with Sendai, Ishinomaki and Takizawa venues, the second dojo was in February 2013- March 2013 with Ishinomaki and Takizawa venues, and the third dojo will be held on April 2013- June 2013 with Sendai, Ishinomaki, Takizawa, Kitakami and Kanazawa.
Many of the dojo participants are highschool students, but we have housewives, designers, and even junior highschool students.
Preparing for the next disaster - preparing data sets
During the earthquake in 2011, many local governments, tech companies and citizens were scrambling to gather data, provide data, find data, and it was a chaos. Learning from that experience, many Japanese local governments and data holders (infrastructure companies) are starting to partner with tech companies so that when the next disaster happens, they will be prepared to provide data to the citizens involved.
For example, Google partnered with 7 local governments in Japan so that they can provide various data in case of natural disasters- safety information, evacuation center and evacuation routes, hazard maps, etc, and Google will map those data on Google maps and provide to the citizens.

[demo based on evacuation center data provided by Kawasaki City]
Also, NTT Docomo, KDDI, Softbank Mobile (mobile carriers in Japan) are providing their mobile signal recovery data- whether you have mobile signal or not is extremely important in securing communication during crisis. Tokyo Gas is providing gas lifeline data. Gas is important to secure heat and cooking. Honda will be providing car traffic information data based on their GPS on automobiles- during the 2011 crisis, coastal areas were hit by tsunami and it was hard to know which roads are drivable. Honda's data helped to figure out where they should go with their cars. FirstMedia and WeatherNews will be providing their evacuation center data and citizen reports on disasters.

[demo based on Honda's data from 2011/3/16]
Preparing for the next disaster - learn from dataAfter 1.5 years have passed since the earthquake, we launched a project called "Project311- The Great East Japan Earthquake Big Data Workshop" to gather researchers and developers to revisit and analyze various data from the quake, to get a clue of what can be done to prepare for future disasters.
Data provided includes Asahi Shimbun newspaper articles, Google Insights for Search, text summary of television broadcasts made just after the Great East Japan Earthquake, tweets from the week after March 11, transcripts of the audio broadcasted by NHK in the 24 hours following the disaster and a ranking of frequently used words, Honda Internavi traveled roads data, Rescuenow's railroad operation information and various disaster-related information, traffic congestion statistics from cell phone data, etc.
If you are interested in this project, I started writing blog post about them separately so please check it out.
Project311- About the Data
The bottom line is, there still a long way to go till recovery, but we're doing a lot, making a lot of efforts to help for the recovery of Japan, and it's important that we keep doing it.
Disclaimer: The opinions expressed here are my own, and do not reflect those of my employer. -Fumi Yamazaki