Today I joined Technologies for Crisis Response & Community Resilience meeting at Berkeley and here are some notes.
Agenda of the conference:
Democratizing Access to Information About our Changing Planet
Andrew Zolli (Planet Labs)
Our collective resilience challenge:
- How do we help communities and systems persist, recover and thrive amid disruption?
- How do we make communities listen? > sociological issue, not technical issue.
- We should be in age of big indicator, NOT age of big data.
Successful crisis response:
- Context specific
- Bound together in ad hoc manner (like Jazz)
- No single enterprise, tool, or organization can solve everything in disasters and resilience.
Crisis response should be considered in broader time horizon
- Natural or manmade disaster, refugees used to be 8 years in past, increased to 20 years (baby gets adult in shelters...)
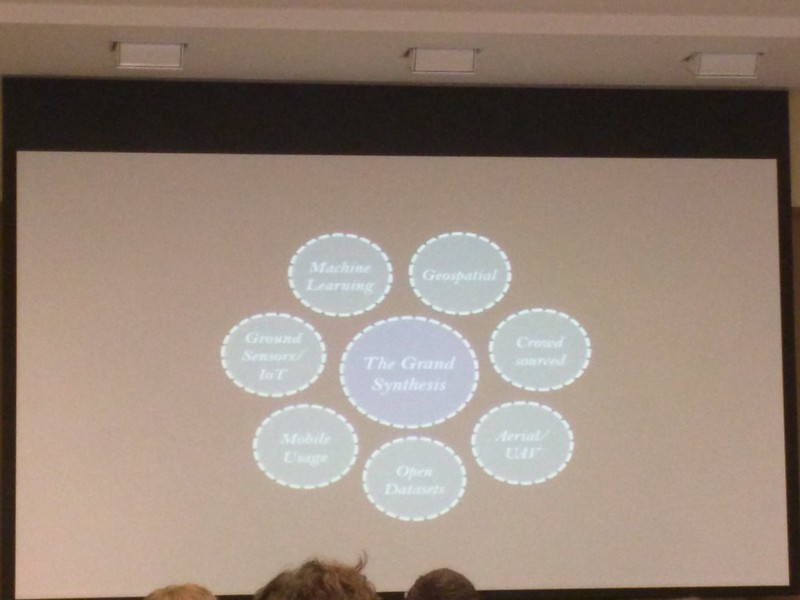
Planet Labs > aiming to get visuals everywhere, every day, will enable a new approach to water, nature, city planning.
We can make API today, but everything might change tomorrow. It is more important to do capacity building. We need to work "with not for" the communities.
Agenda of the conference:
Democratizing Access to Information About our Changing Planet
Andrew Zolli (Planet Labs)
Our collective resilience challenge:
- How do we help communities and systems persist, recover and thrive amid disruption?
- How do we make communities listen? > sociological issue, not technical issue.
- We should be in age of big indicator, NOT age of big data.
Successful crisis response:
- Context specific
- Bound together in ad hoc manner (like Jazz)
- No single enterprise, tool, or organization can solve everything in disasters and resilience.
Crisis response should be considered in broader time horizon
- Natural or manmade disaster, refugees used to be 8 years in past, increased to 20 years (baby gets adult in shelters...)
Planet Labs > aiming to get visuals everywhere, every day, will enable a new approach to water, nature, city planning.
We can make API today, but everything might change tomorrow. It is more important to do capacity building. We need to work "with not for" the communities.
NGOs- need a new model of funding, collaborating, experimenting and sharing.
Newest things are always the most fragile. Old technology is not sophisticated but robust. Make the new technologies less fragile by working with the existing systems. Not about Silicon Valley way of disruption, we need to be working with existing processes. We need to be agile enough to work in different ways and adjust to local communities.
Assessing Impacts in Agriculture at Ultra-low Costs
LSMS (Living Standards Measurement Study)
David Lobell (Stanford University) & Talip Kilic (World Bank)
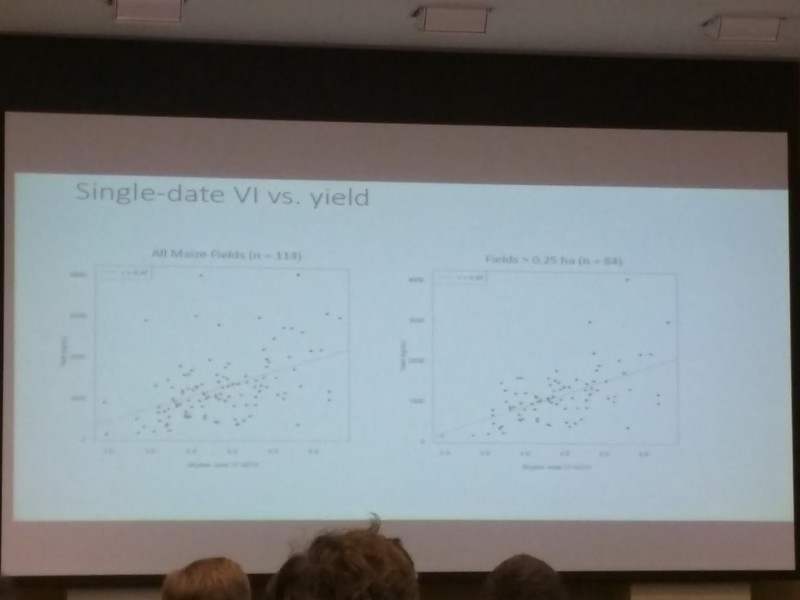
-3 elements for ultra-low cost accurate crop monitoring
1) Satellite data 2) Computation (Google Earth Engine) 3) Robust algorithms
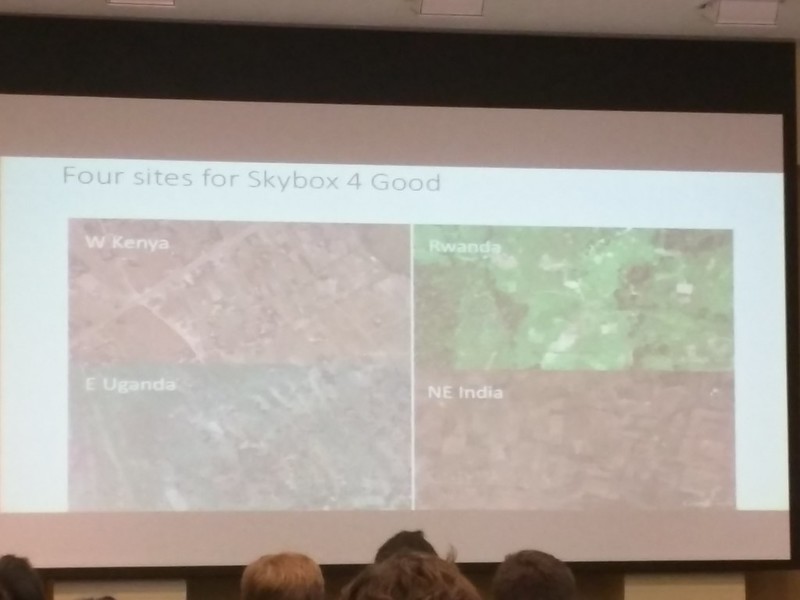
Joined Skybox for Good program
Testing in 4 areas: West Kenya, East Uganda, Rwanda and NE India.
Example in Kenya
- Got imagery and walked the fields
- Vegetation, measured the facts and on the ground information and data
Example in India
- Crop cuts
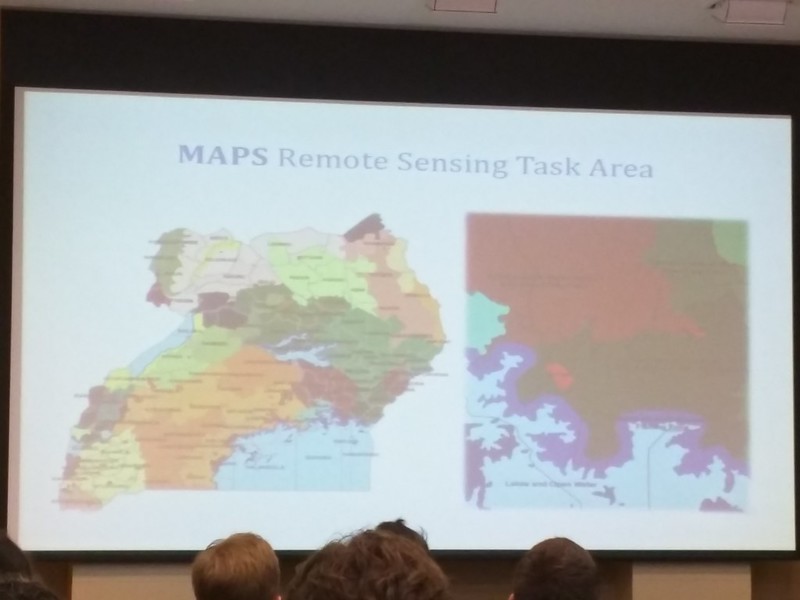
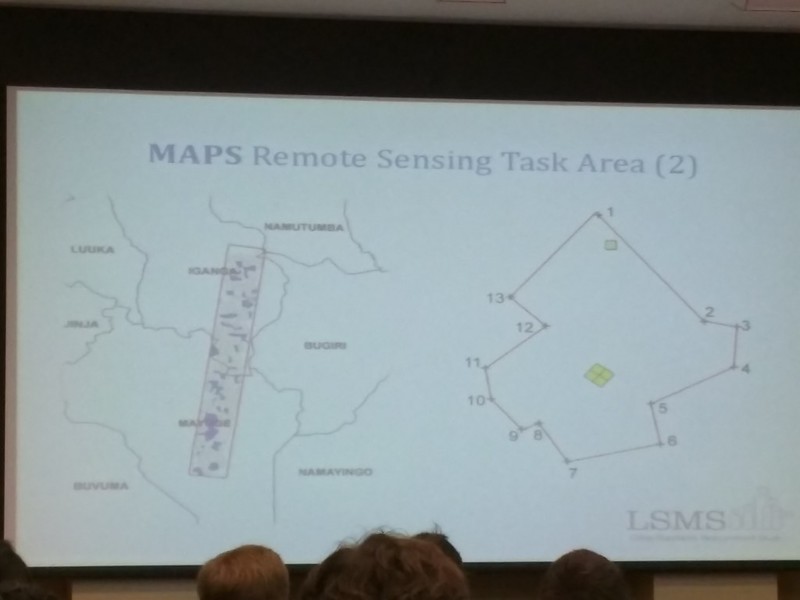
Example in Uganda
- Development Research Group at World Bank
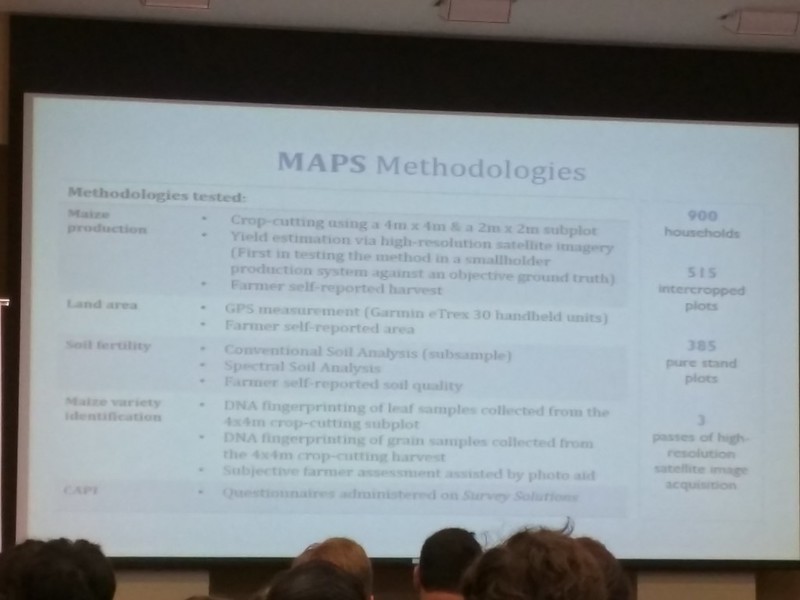
Maize Productivity, variety and soil fertility (MAPS)
- Supported by LSMS methodological validation program
- Test subjective approaches to measurement vis a vis objective methods for maize production, variety and soil fertility
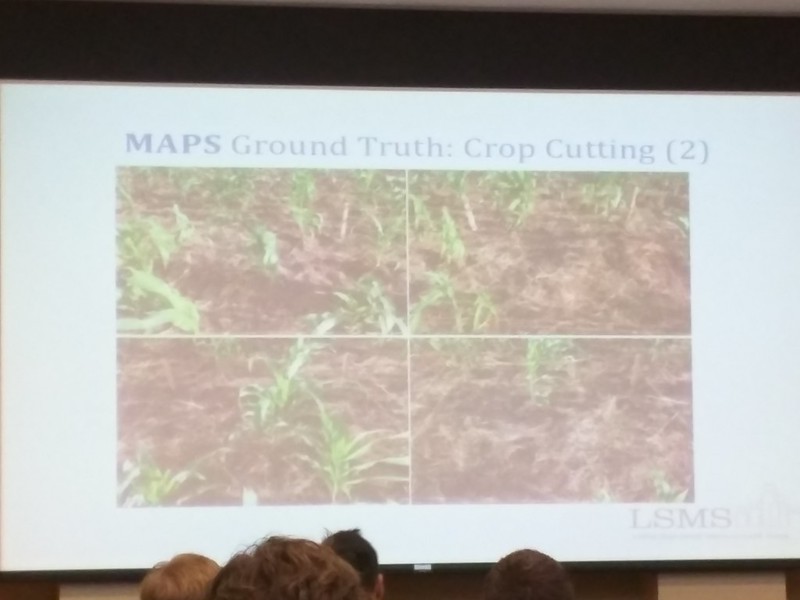
- Crop cutting is gold standard
- Physical measurement
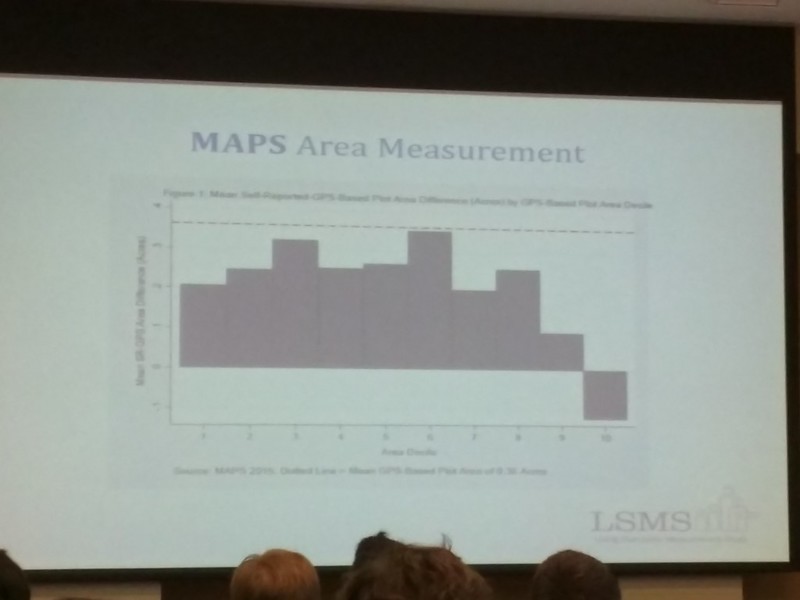
MAPS methodologies
- GPS data vs data that farmers are reporting (farmers are over estimating)
Difficulty in data: Even in this quadrant, crop density is very different
- In the past: lack of attention to data quality
- High frequency surveys of households and communities at strategically selected locations
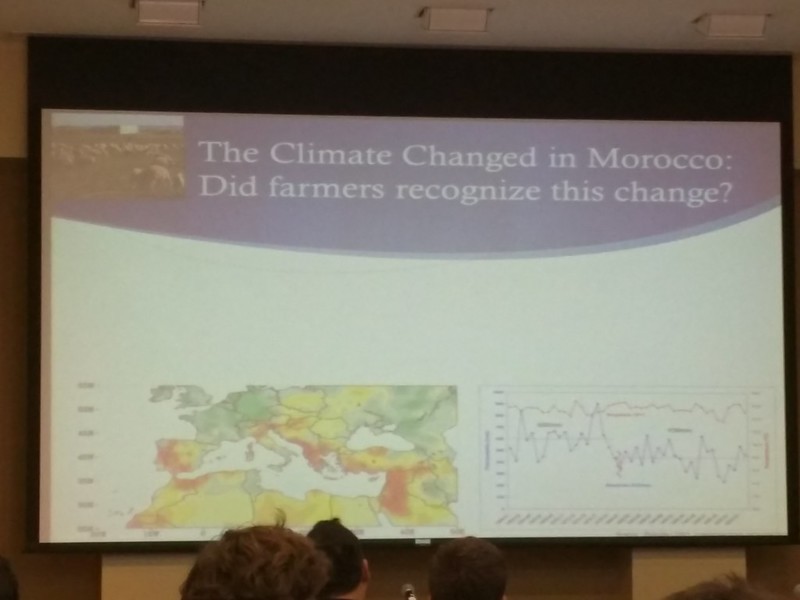
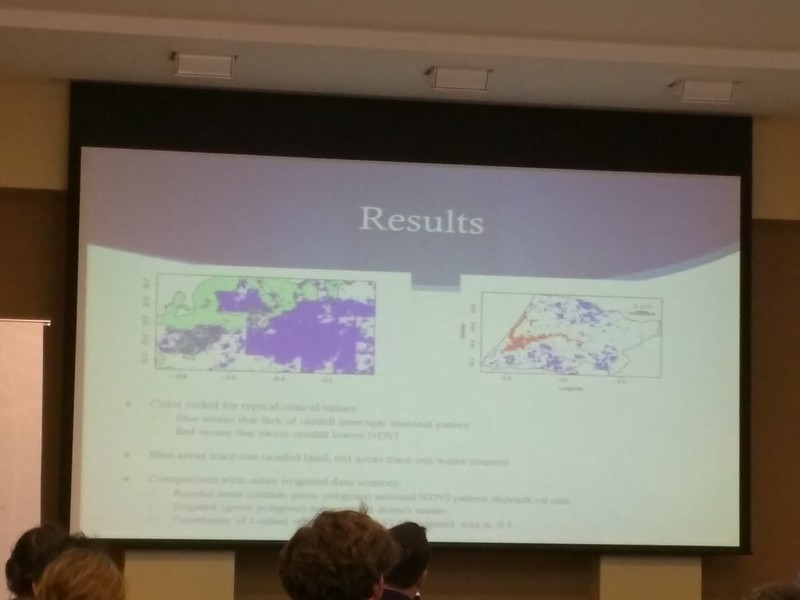
Differentiating Irrigated and Rainfed Agriculture for Efficient Water Usage in Morocco
Travis Lybbert & Michael Norton (UC Davis)
Climate change: notice change and then adapt... resilience requires recognition that "something changed". How well and quickly can farmers detect those changes? A lot of noise, complicated learning, tough learning process.
Looking at Kilimanjaro everyday- the farmers has the history. But there's good years and bad years, how can farmers detect the bigger changes? Farmer-level decision making. Can we track the spatial and temporal diffusion of irrigated agriculture in recent decades using satellite images?
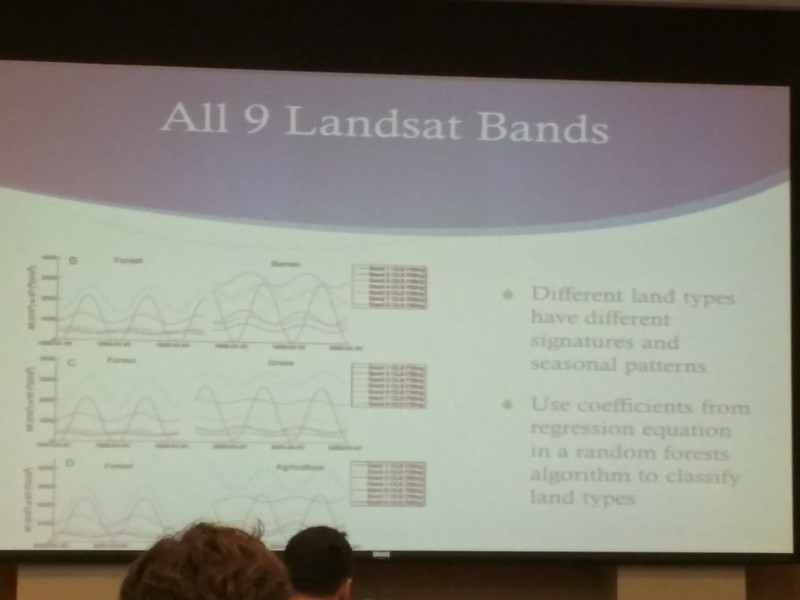
Existing data and methods:
-Moroccan Agricultural Atlas and FAO AQUASTAT raster files, etc
-Methods: land cover change detection (comparison of 2-3 scenes to using them all)
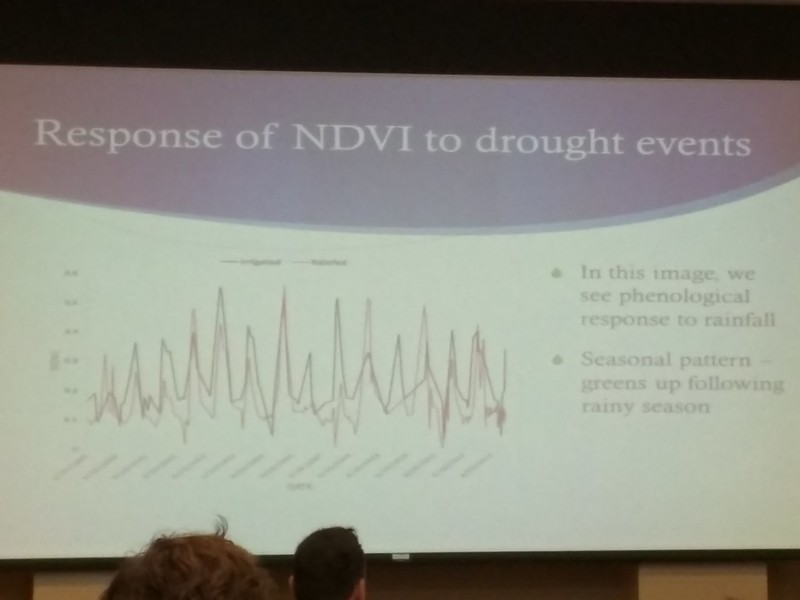
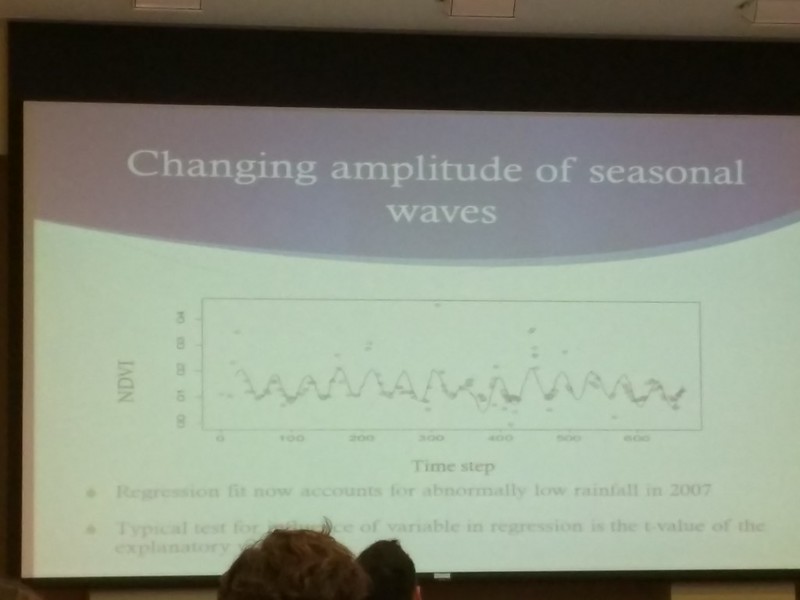
-Continuous Change Detection and Classification (CCDC) Algorithm
Seasonal patterns
High-resolution Earth Imagery for Sustainable Development
Taner Kodanaz (DigitalGlobe)
- Better understand and better seeing, solving the problems, not just consuming imagery but working to bring them into existing systems.
- Small and agile organizations do better at utilizing those data, but when come into national, UN, World Bank level, things are more difficult and we need to find out how to collaborate.
Global challenges
Agriculture, environment, human rights, infrastructure development
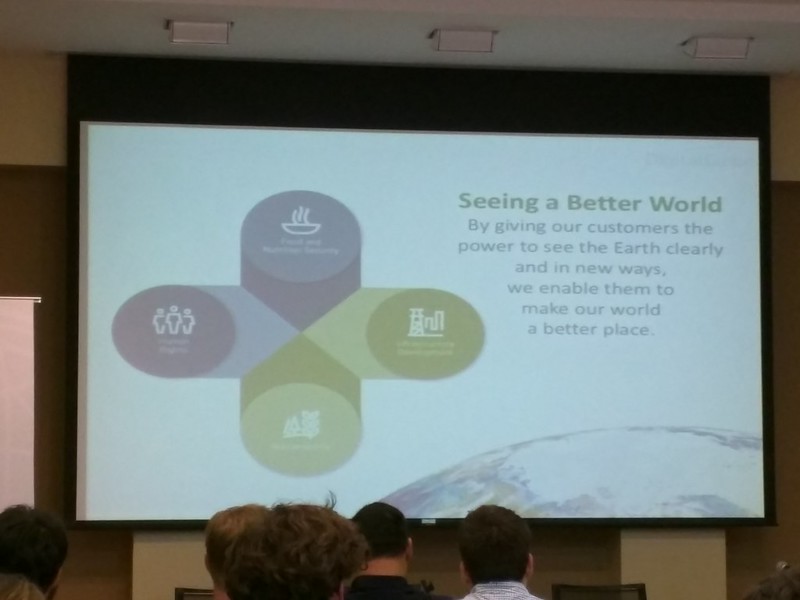
Digital Globe is focused on how to help organizations make better decisions by giving the customers the power to see the earth clearly and in new ways, enable them to make a better place whether it is through increasing efficiency or saving lives, etc.
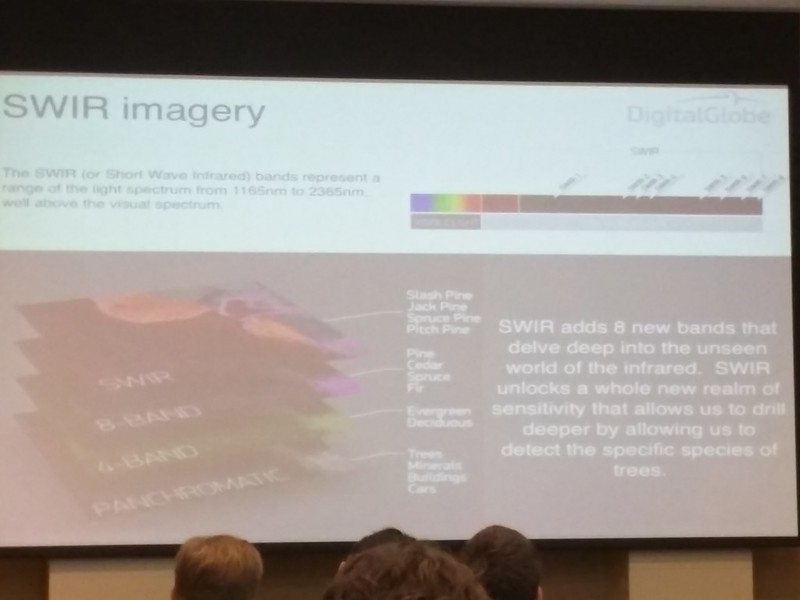
What satellites can see and can't see:
Panchromatic imagery (black and white) -trees, minerals, etc
4-band imagery - differentiate evergreen and deciduous tree
8-band imagery - pine, cedar etc
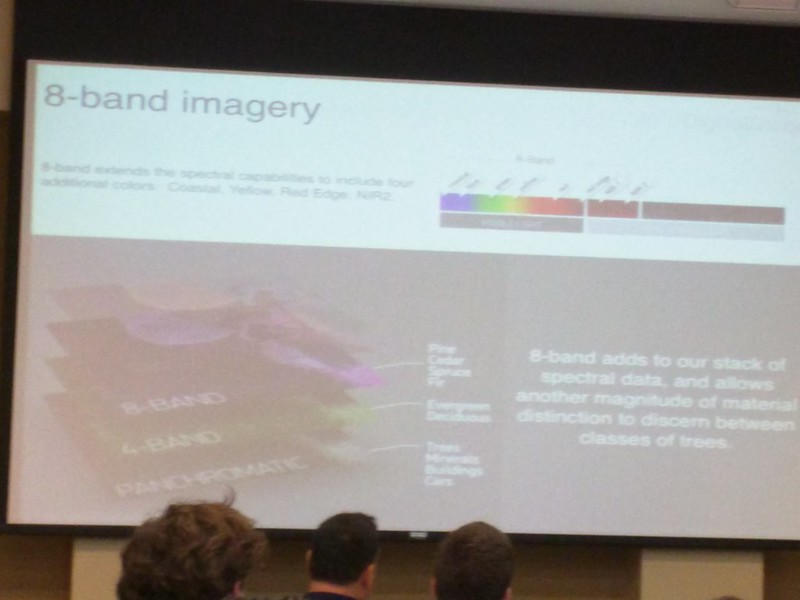
SWIR imagery (short wave infrared)
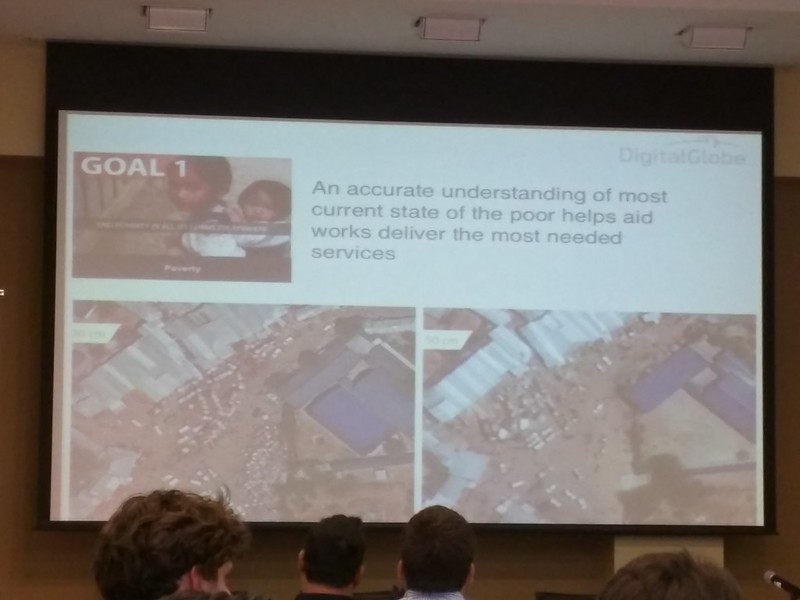
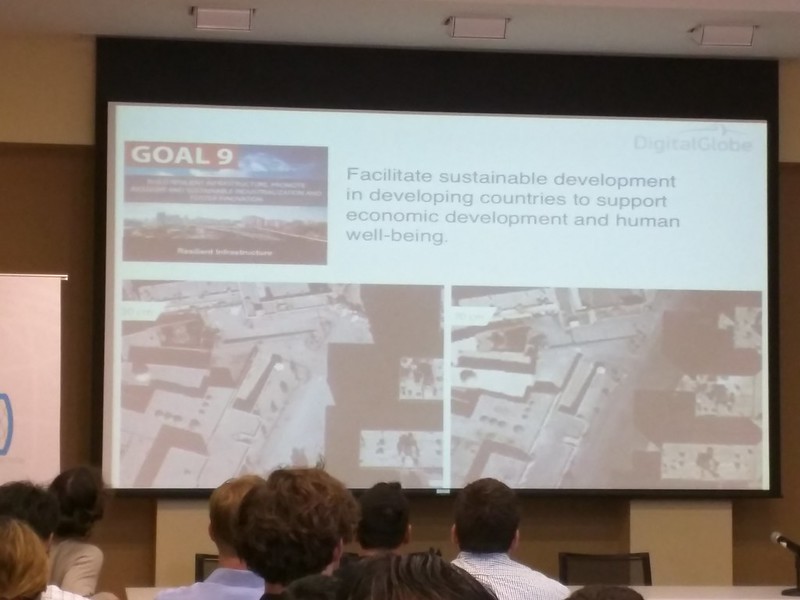
UN's 17 sustainable development goals:
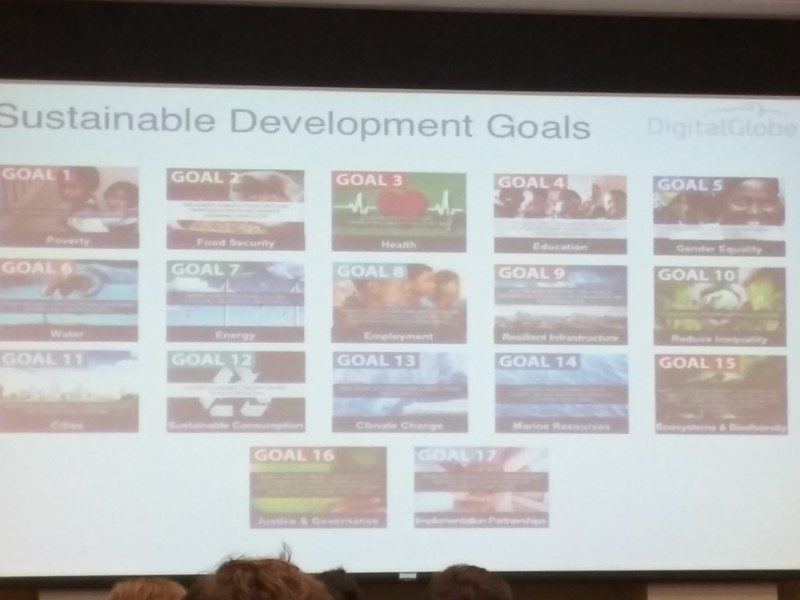
Through those imagery, we can see individuals, where people are living and moving, and the infrastructure to meet those goals.
"The surface of Earth itself is an immense loom upon which the sun weaves the fabric of existence"
Q: How do we include the communities and right insights that they have? They are the ones who has insights and implementation for resilience, not the ones who are working on data and algorithms
A: Working together with communities
Disclaimer: The opinions expressed here are my own, and do not reflect those of my employer. -Fumi Yamazaki
Newest things are always the most fragile. Old technology is not sophisticated but robust. Make the new technologies less fragile by working with the existing systems. Not about Silicon Valley way of disruption, we need to be working with existing processes. We need to be agile enough to work in different ways and adjust to local communities.
Assessing Impacts in Agriculture at Ultra-low Costs
LSMS (Living Standards Measurement Study)
David Lobell (Stanford University) & Talip Kilic (World Bank)
-3 elements for ultra-low cost accurate crop monitoring
1) Satellite data 2) Computation (Google Earth Engine) 3) Robust algorithms
Joined Skybox for Good program
Testing in 4 areas: West Kenya, East Uganda, Rwanda and NE India.
- Got imagery and walked the fields
- Vegetation, measured the facts and on the ground information and data
Example in India
- Crop cuts
Example in Uganda
- Development Research Group at World Bank
Maize Productivity, variety and soil fertility (MAPS)
- Supported by LSMS methodological validation program
- Test subjective approaches to measurement vis a vis objective methods for maize production, variety and soil fertility
- Crop cutting is gold standard
- Physical measurement
MAPS methodologies
- GPS data vs data that farmers are reporting (farmers are over estimating)
- In the past: lack of attention to data quality
- High frequency surveys of households and communities at strategically selected locations
Differentiating Irrigated and Rainfed Agriculture for Efficient Water Usage in Morocco
Travis Lybbert & Michael Norton (UC Davis)
Climate change: notice change and then adapt... resilience requires recognition that "something changed". How well and quickly can farmers detect those changes? A lot of noise, complicated learning, tough learning process.
Looking at Kilimanjaro everyday- the farmers has the history. But there's good years and bad years, how can farmers detect the bigger changes? Farmer-level decision making. Can we track the spatial and temporal diffusion of irrigated agriculture in recent decades using satellite images?
Existing data and methods:
-Moroccan Agricultural Atlas and FAO AQUASTAT raster files, etc
-Methods: land cover change detection (comparison of 2-3 scenes to using them all)
-Continuous Change Detection and Classification (CCDC) Algorithm
Seasonal patterns
High-resolution Earth Imagery for Sustainable Development
Taner Kodanaz (DigitalGlobe)
- Better understand and better seeing, solving the problems, not just consuming imagery but working to bring them into existing systems.
- Small and agile organizations do better at utilizing those data, but when come into national, UN, World Bank level, things are more difficult and we need to find out how to collaborate.
Global challenges
Agriculture, environment, human rights, infrastructure development
Digital Globe is focused on how to help organizations make better decisions by giving the customers the power to see the earth clearly and in new ways, enable them to make a better place whether it is through increasing efficiency or saving lives, etc.
What satellites can see and can't see:
Panchromatic imagery (black and white) -trees, minerals, etc
4-band imagery - differentiate evergreen and deciduous tree
8-band imagery - pine, cedar etc
SWIR imagery (short wave infrared)
UN's 17 sustainable development goals:
Through those imagery, we can see individuals, where people are living and moving, and the infrastructure to meet those goals.
"The surface of Earth itself is an immense loom upon which the sun weaves the fabric of existence"
Q: How do we include the communities and right insights that they have? They are the ones who has insights and implementation for resilience, not the ones who are working on data and algorithms
A: Working together with communities
Disclaimer: The opinions expressed here are my own, and do not reflect those of my employer. -Fumi Yamazaki
0 件のコメント:
コメントを投稿